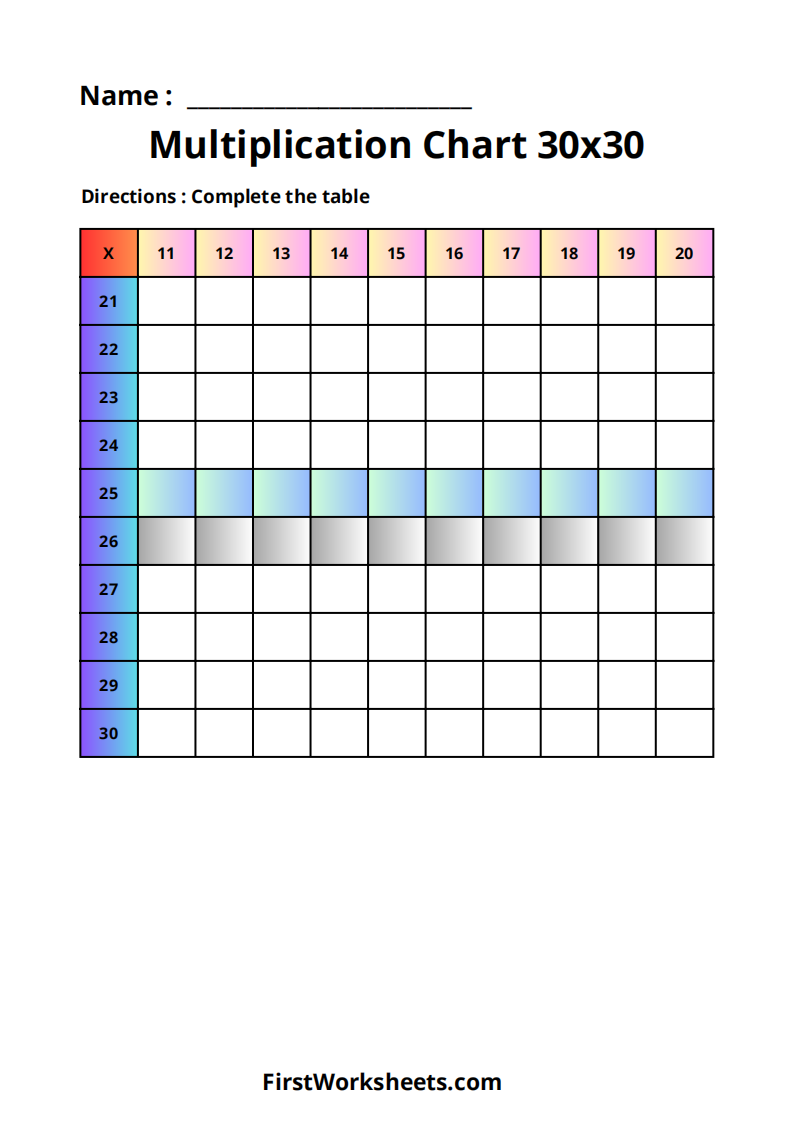
Multiplication Table Chart 30x30 Worksheets
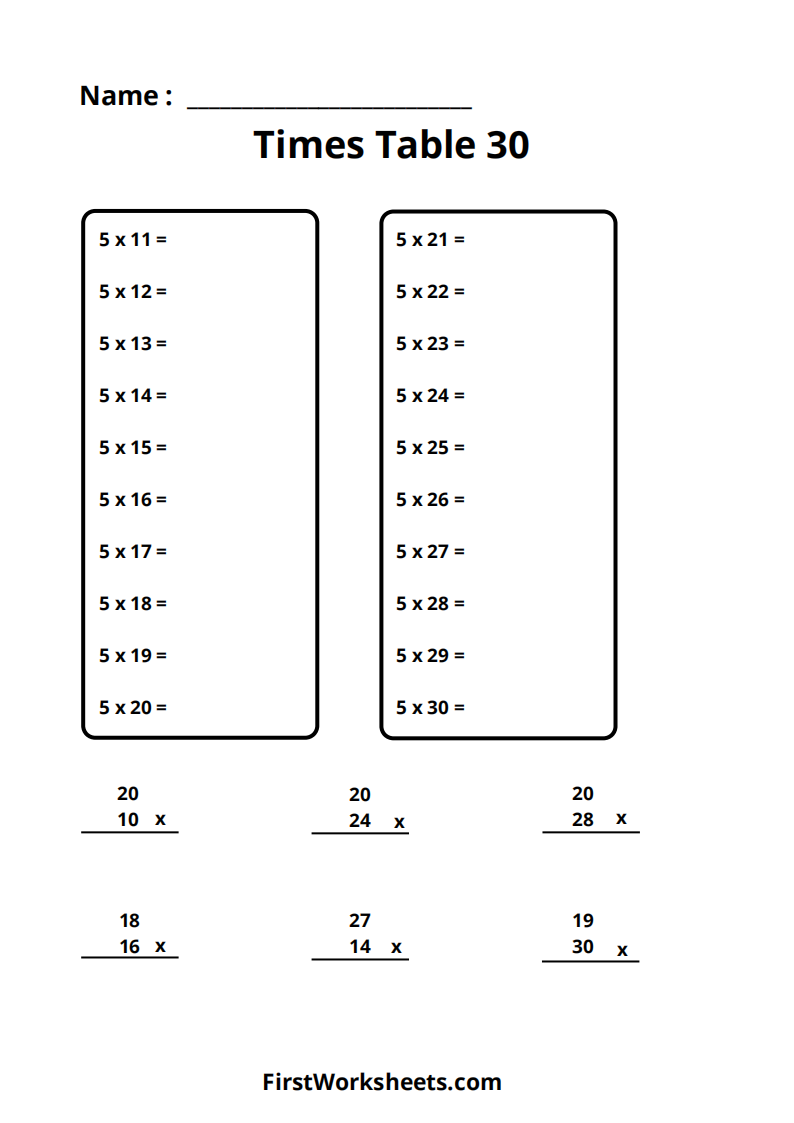
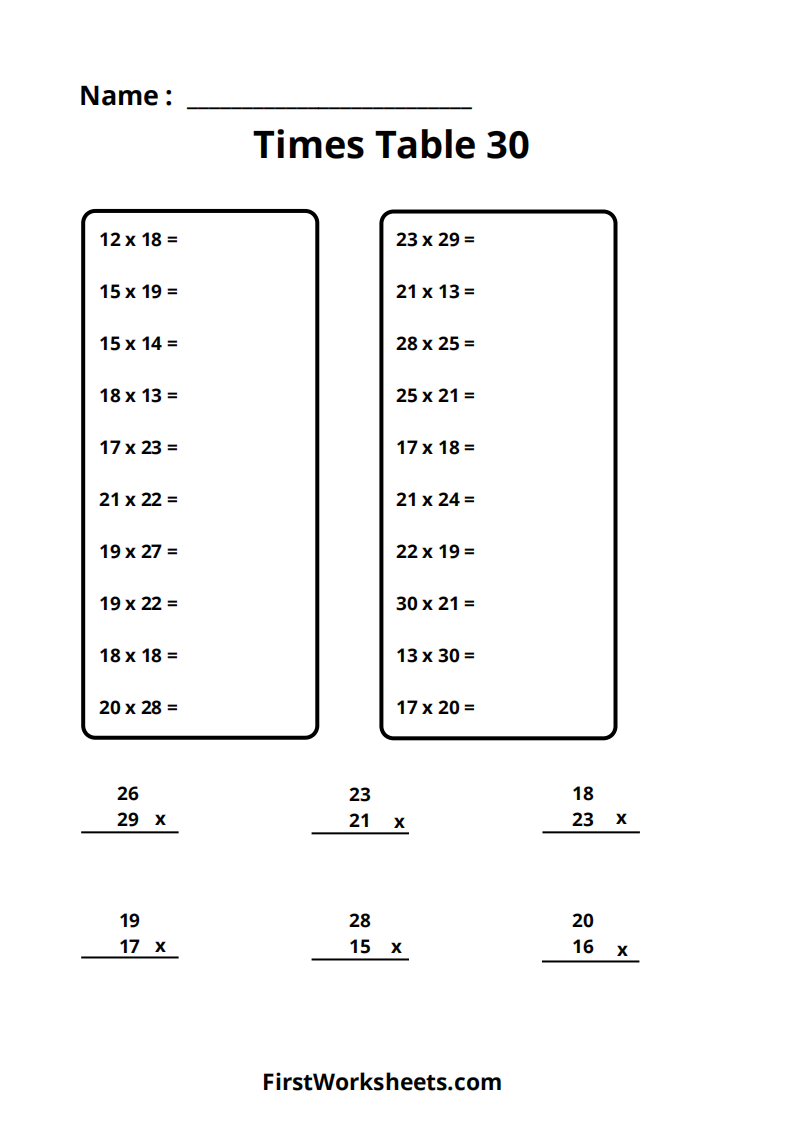
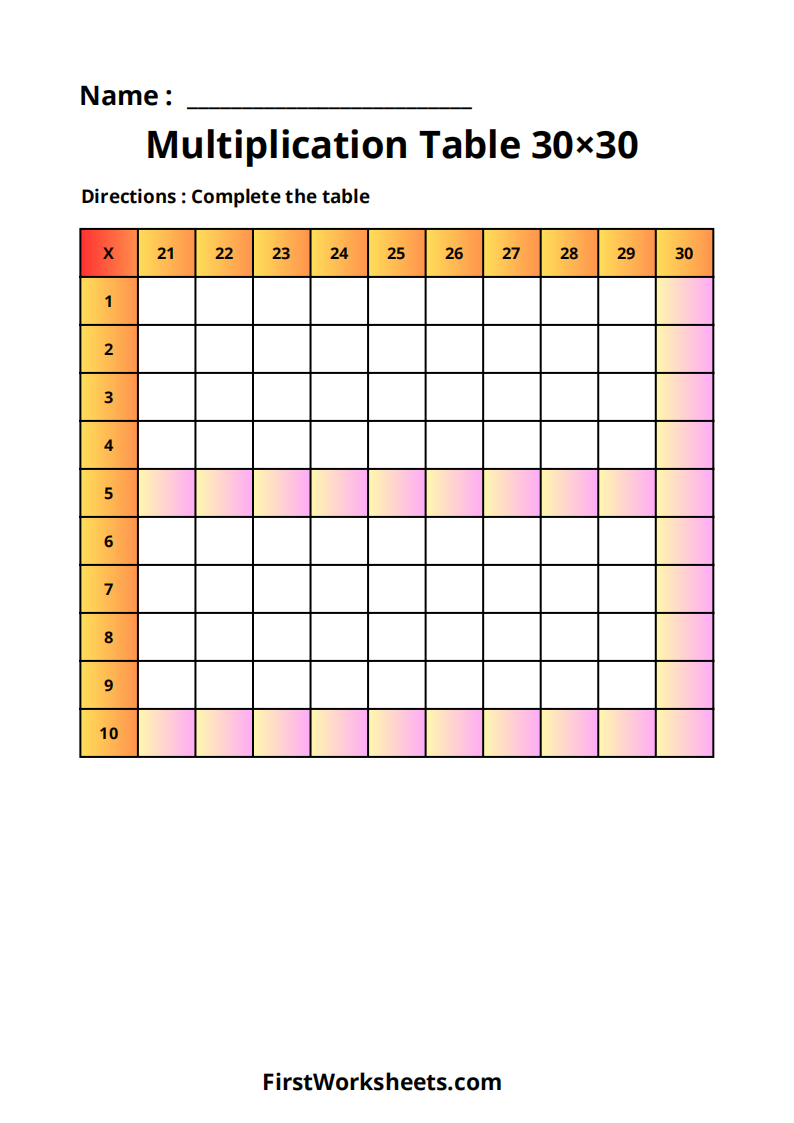
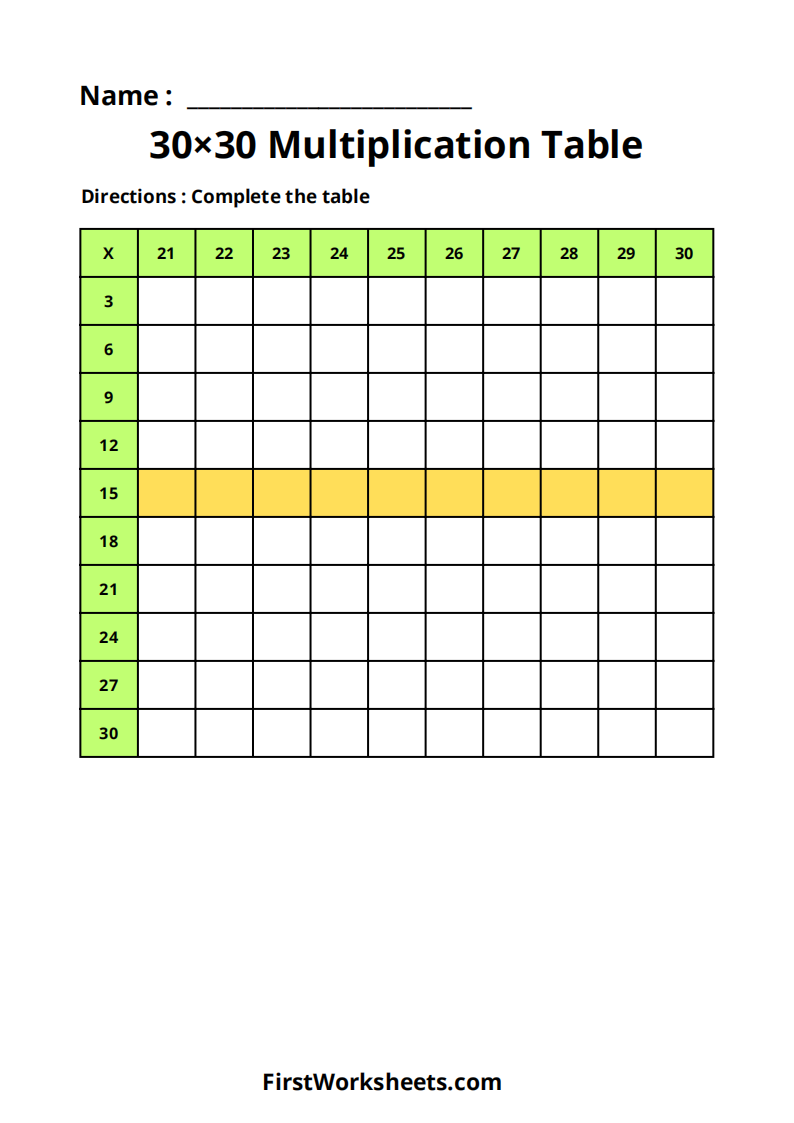
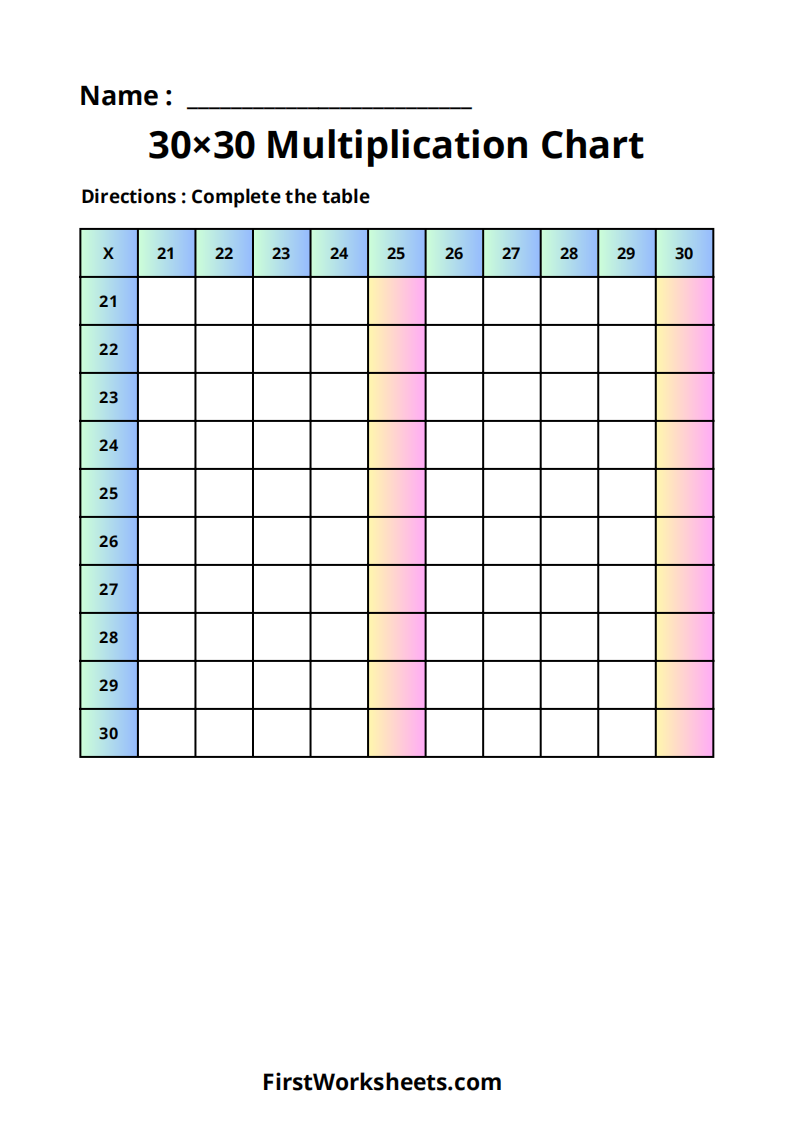
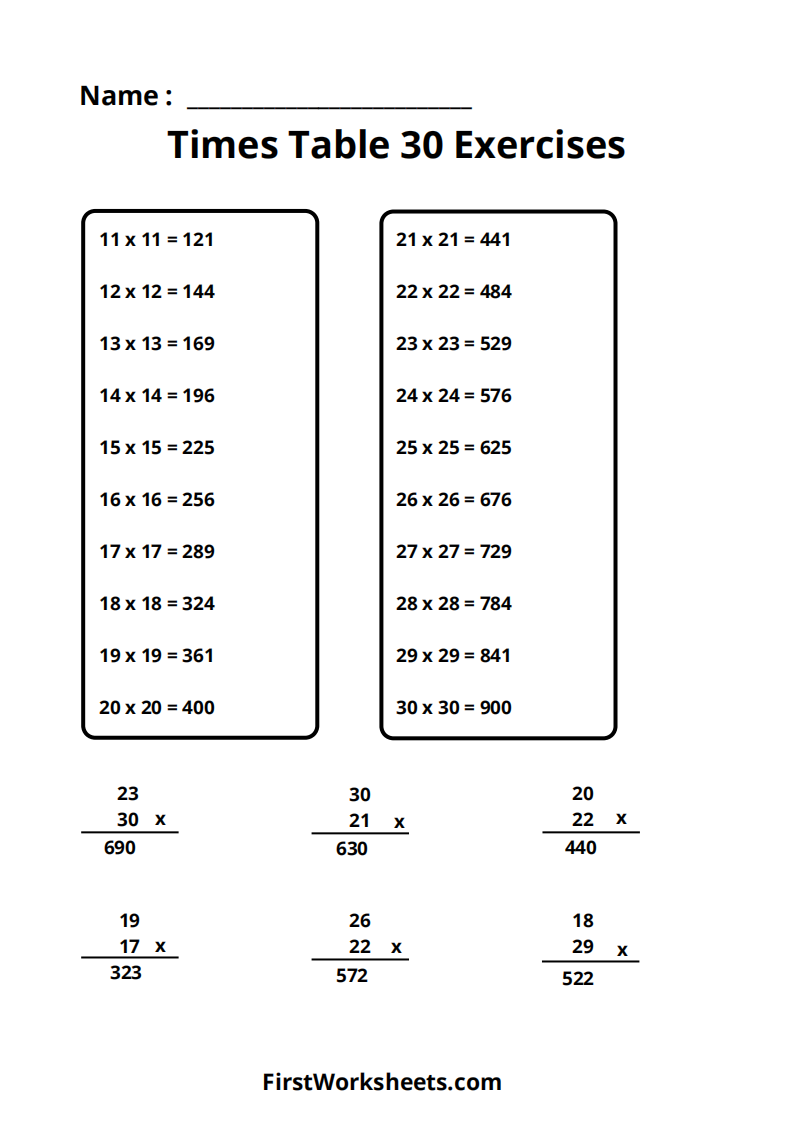
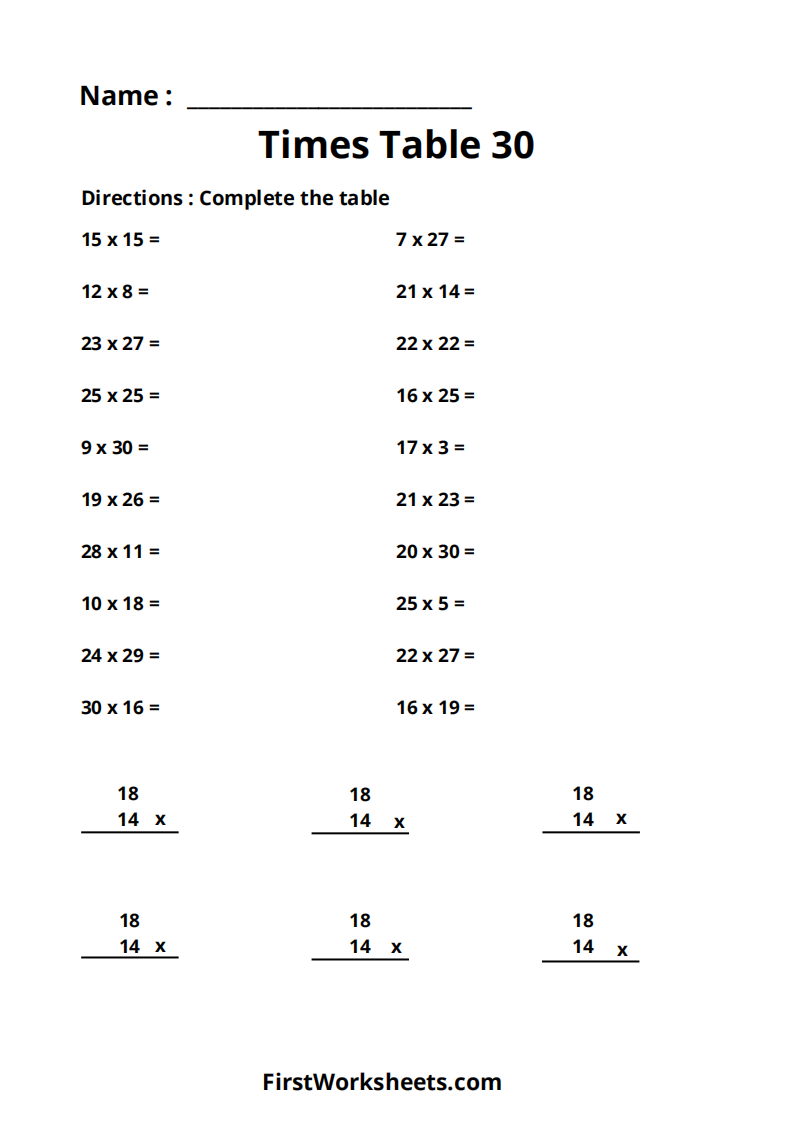
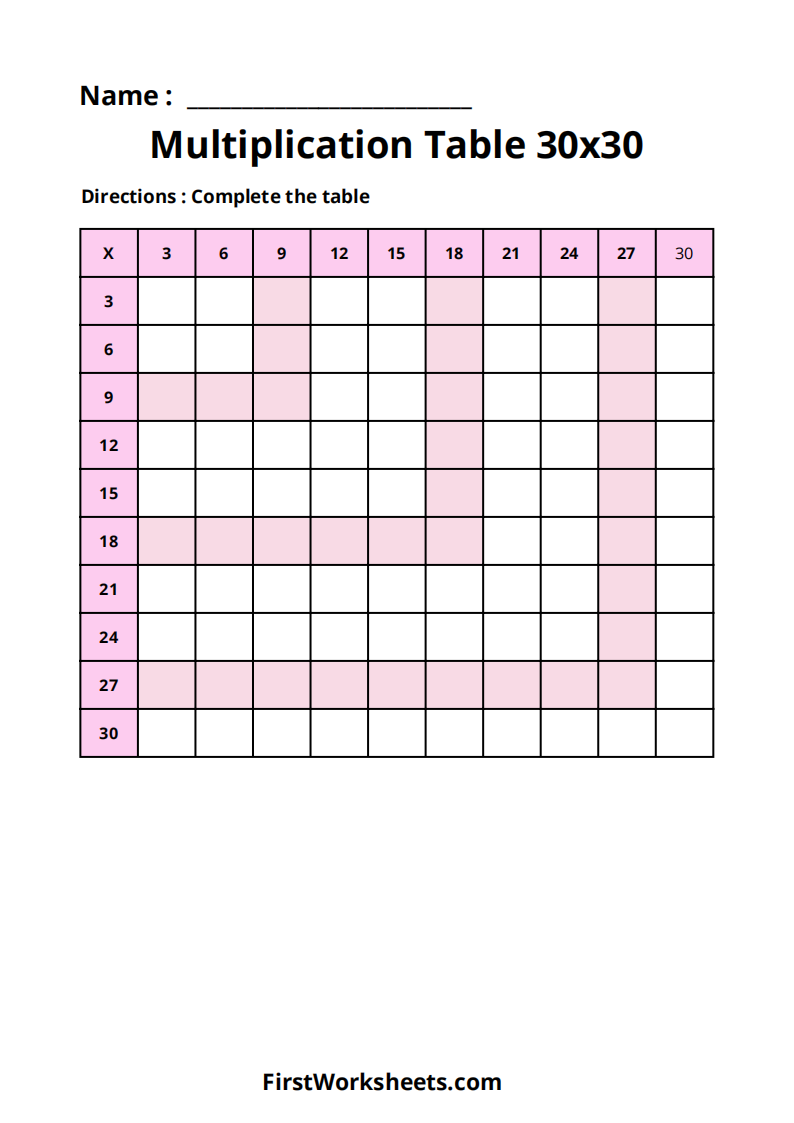
A 30×30 multiplication table worksheet is designed to help students practice and enhance their understanding of multiplication for numbers ranging from 1 to 30. Here’s a breakdown of what such a worksheet includes, how it benefits students, and how it can be used effectively:
Structure of the 30×30 Multiplication Chart
- Headers: The top row and the first column usually contain the base numbers (1 through 30) that are to be multiplied.
- Rows and Columns: The chart consists of 30 rows and 30 columns, where each row and column corresponds to numbers from 1 to 30.
- Cells: Each cell in the chart represents the product of the corresponding row and column numbers. For example, the cell where row 5 and column 6 intersect will have the value 5×6=305 \times 6 = 30.
Why a 30×30 Table?
- Extended Range: While traditional multiplication charts often cover numbers from 1 to 10 or 1 to 12, a 30×30 table allows students to explore higher multiplication facts, making it suitable for more advanced students or those seeking a challenge.
- Deeper Understanding: It helps students understand and memorize more complex multiplication facts, which are foundational for mastering higher-level math concepts like division, fractions, algebra, and more.
Educational Benefits
- Improved Memory and Recall: Repeated practice with these worksheets helps students memorize larger multiplication facts, improving their recall speed for more complex math problems.
- Pattern Recognition: A 30×30 multiplication chart allows students to notice patterns in multiplication, such as symmetry (e.g., 6×7=426 \times 7 = 42 is the same as 7×6=427 \times 6 = 42), multiples, and the distribution of even and odd products.
- Problem-solving Skills: By working on higher numbers, students can also develop problem-solving techniques, particularly when working with more extensive and challenging math problems in areas like geometry or algebra.
