Two Way Frequency Table Worksheets
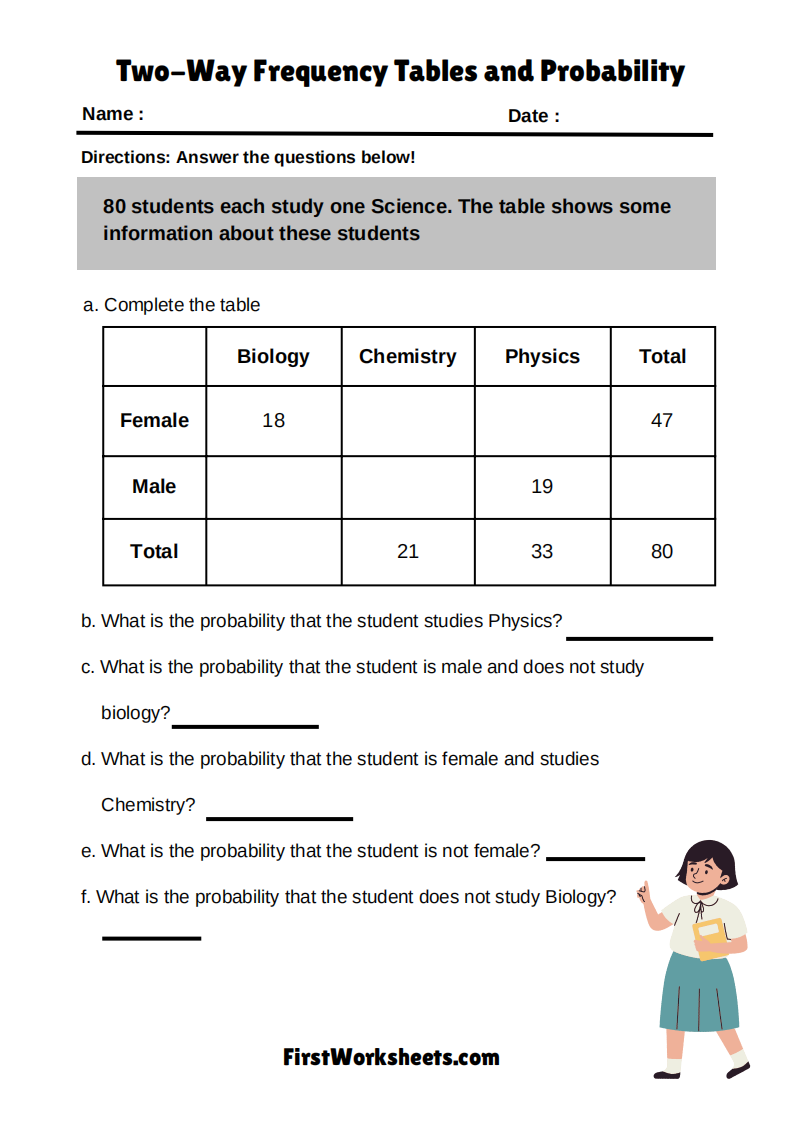
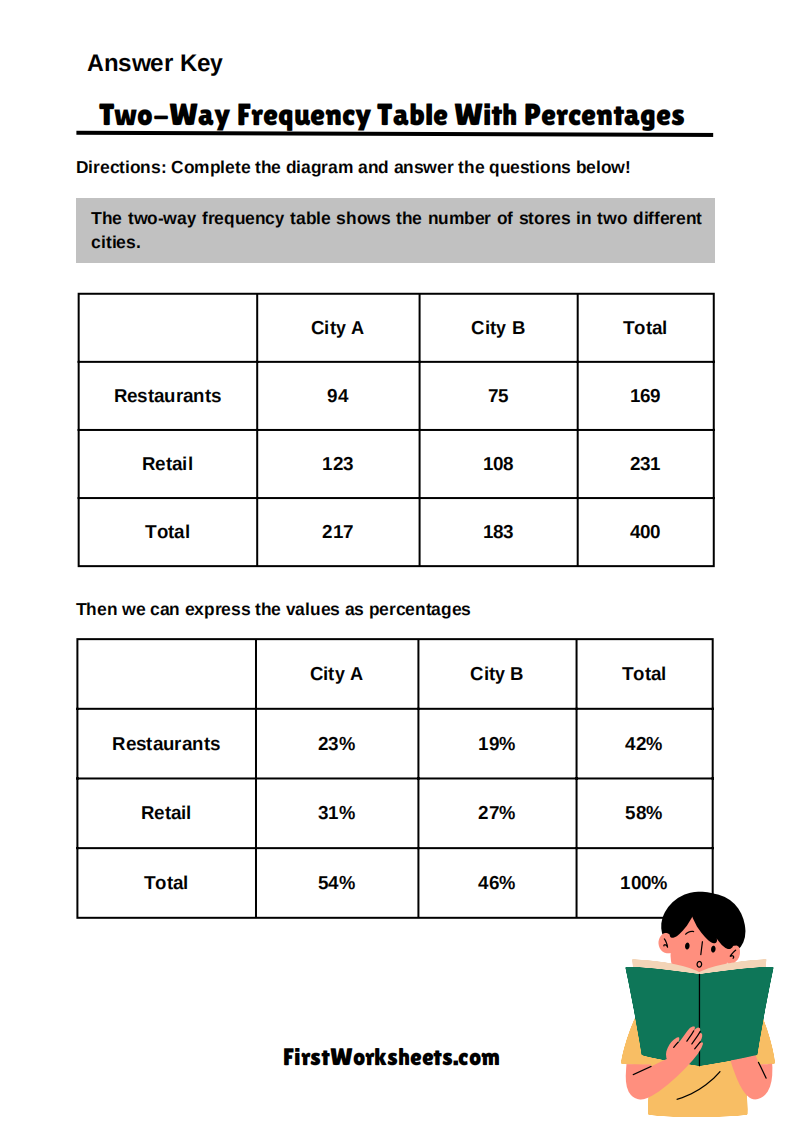
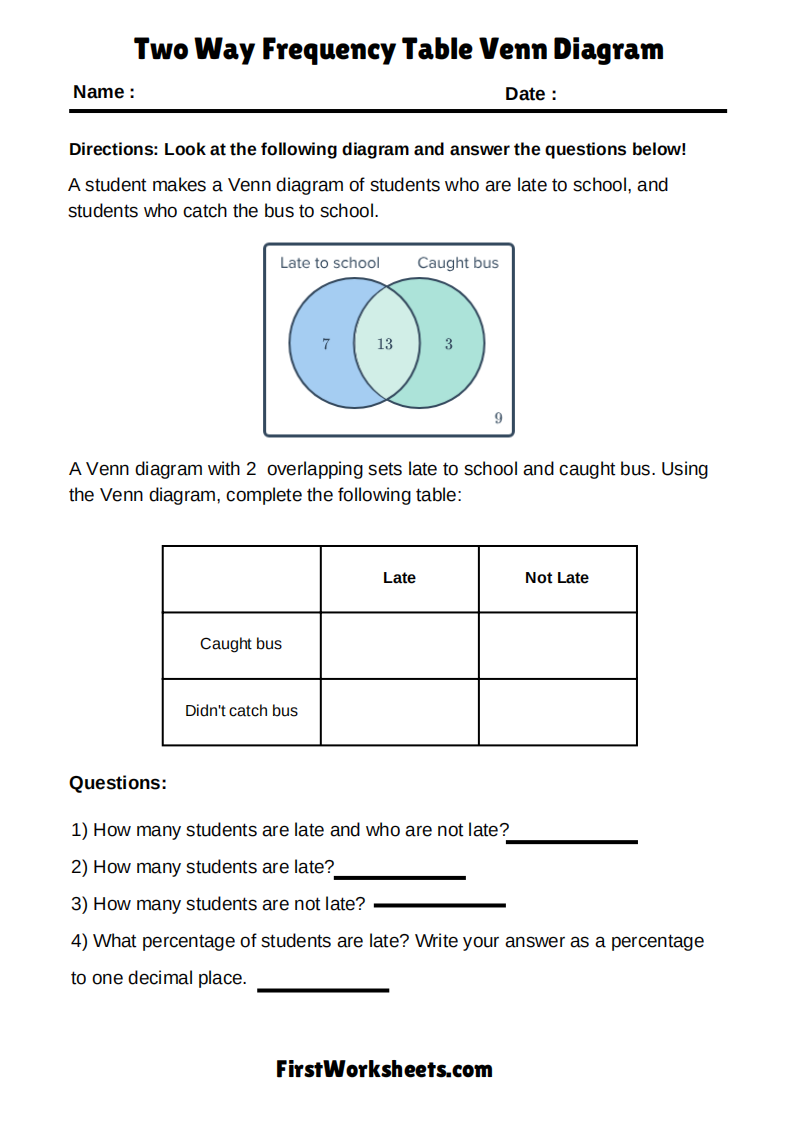
A two-way frequency table is a type of statistical table that displays the frequency (or count) of occurrences of combinations of two categorical variables. Each row of the table corresponds to a category from one variable, and each column corresponds to a category from another variable. The intersections of these rows and columns, called cells, show the frequency of the paired values.
For example, if a class of students is surveyed about their favorite type of fruit and their preferred study method, a two-way frequency table could show how many students prefer each combination of fruit and study method. Understanding this table allows us to see relationships and correlations between the variables.
Components of Two-Way Frequency Tables
A two-way frequency table consists of several key components:
- Rows and Columns: These represent the categories of the two variables being compared.
- Cells: The intersections of rows and columns where the data is displayed.
- Margins: The totals for each row and column, also known as marginal distributions.
- Grand Total: The total number of observations or data points, located at the bottom right of the table.
Creating Two-Way Frequency Tables
Creating a two-way frequency table involves several steps:
- Collect Data: Gather the raw data that you will use for the table. This data should include two categorical variables.
- Organize Data: Sort the data into categories for each variable. Ensure that the categories are mutually exclusive and collectively exhaustive.
- Set Up the Table: Draw a grid with one variable’s categories on the rows and the other’s on the columns.
- Enter Frequencies: Count the number of occurrences for each combination of categories and enter these frequencies into the corresponding cells of the table.
- Calculate Marginal Totals: Add the frequencies across each row and down each column to get the marginal totals.
- Verify the Grand Total: Ensure that the sum of the marginal totals equals the grand total of all observations.
For example, if a survey asks students about their favorite type of music (Pop, Rock, Classical) and their preferred study method (Solo, Group), a two-way frequency table could display how many students prefer each type of music within each study method category.
Example of a Two-Way Frequency Table:
| Pop | Rock | Classical | Total | |
|---|---|---|---|---|
| Solo | 10 | 5 | 3 | 18 |
| Group | 8 | 7 | 5 | 20 |
| Total | 18 | 12 | 8 | 38 |
In this table:
- The cell at the intersection of “Solo” and “Pop” indicates that 10 students prefer Pop music while studying alone.
- The marginal totals at the bottom and right side of the table show the total preferences for each category of music and study method, respectively.
Interpreting Data from Two-Way Frequency Tables
Interpreting a two-way frequency table involves analyzing the data to identify patterns, trends, and relationships between the two variables. Here are key steps to follow:
- Identify High and Low Frequencies: Look for the highest and lowest values in the cells, as these indicate strong or weak associations between the categories.
- Examine Marginal Totals: The marginal totals can provide insights into the overall distribution of each variable.
- Calculate Row and Column Percentages: To better understand the relationships, convert frequencies into percentages based on the row or column totals. This allows for comparisons even if the categories have different totals.
- Look for Trends: Identify any patterns or trends in the data, such as a particular category consistently having higher frequencies.
- Consider Conditional Distributions: Conditional distributions can help to understand the probability of one variable occurring given the presence of another.
Real-Life Applications
Two-way frequency tables are not just academic exercises; they have practical applications across various fields:
- Education: Teachers use these tables to analyze student performance across different subjects and teaching methods.
- Business: Marketers analyze customer preferences across different demographics to tailor their campaigns effectively.
- Healthcare: Researchers use two-way frequency tables to study the relationship between lifestyle choices and health outcomes.
- Social Sciences: Sociologists examine how different factors such as age and education level correlate with social behaviors.
These applications demonstrate the versatility and importance of two-way frequency tables in understanding complex relationships between variables.
Common Challenges and Solutions
Despite their usefulness, working with two-way frequency tables can present challenges:
- Misclassification of Data: Ensure that each data point is accurately categorized to avoid skewing the results.
- Ignoring Marginal Totals: Marginal totals provide critical context for interpreting the table. Always consider them when analyzing the data.
- Overlooking Small Sample Sizes: Small sample sizes can lead to misleading results, as random variation can have a more significant impact.
To overcome these challenges, it’s important to double-check data entries, consider the context provided by marginal totals, and be cautious when interpreting results from small samples.
Benefits of Using Two-Way Frequency Table Worksheets:
- Hands-On Learning: Worksheets provide students with practical experience, reinforcing theoretical knowledge through active engagement.
- Skill Development: Regular practice with these tables enhances students’ abilities in data organization, interpretation, and statistical reasoning.
- Critical Thinking: Analyzing the relationships between variables in two-way tables encourages deeper thinking about data and its implications.
Two-way frequency tables are more than just tools for organizing data; they are gateways to understanding the complex relationships that exist within data sets. By mastering the creation and interpretation of these tables, students and professionals alike can enhance their analytical skills and apply them across various fields. Through practice, application, and advanced analysis, the knowledge gained from two-way frequency tables can provide valuable insights into data and drive informed decision-making.


