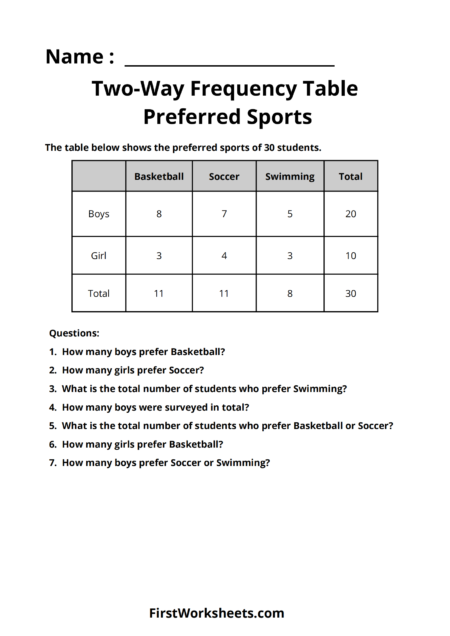
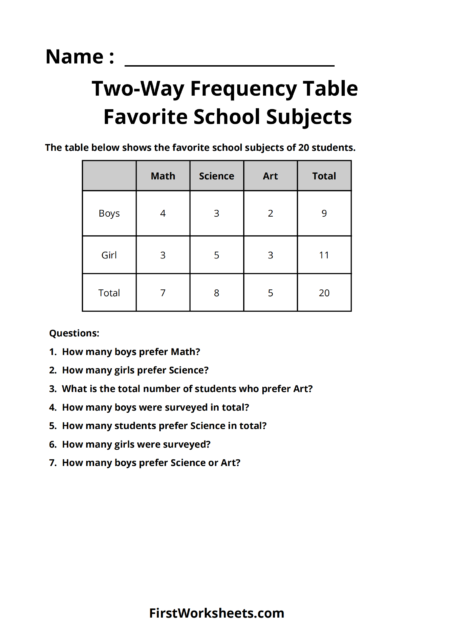
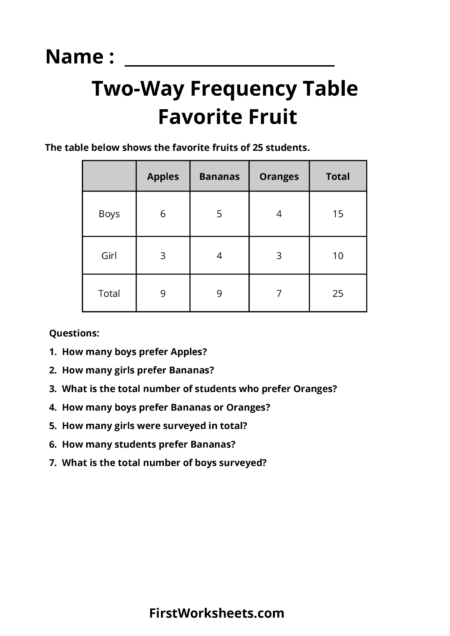
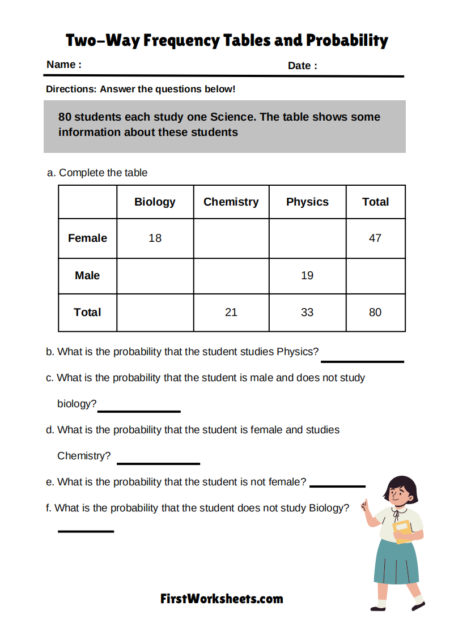
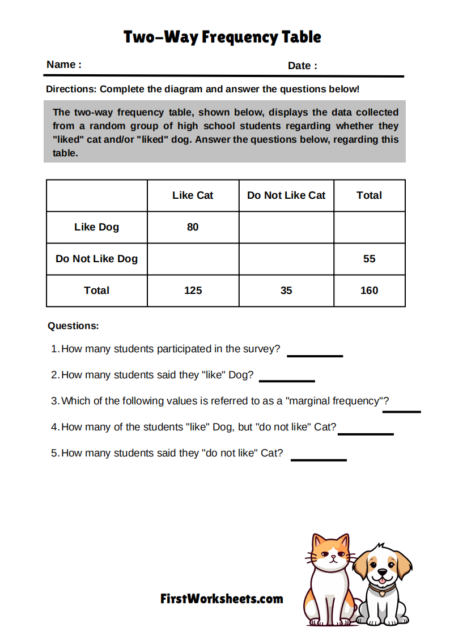
This worksheet focuses on interpreting data from a two-way frequency table. The table organizes information about the favorite ice cream flavors of a group of students. It categorizes the students by gender (boys and girls) and their preferred ice cream flavor (vanilla, chocolate, and strawberry).
The purpose of this worksheet is to help students practice:
- Reading and Understanding Data: Students are asked questions that require them to locate specific values within the table. For example, “How many boys prefer Vanilla?” requires finding the intersection of the “Boys” row and the “Vanilla” column.
- Calculating Totals: Students need to calculate sums based on the data. For instance, “What is the total number of students who prefer Strawberry?” involves adding the number of boys and girls who chose strawberry.
- Analyzing Relationships: Some questions require a deeper understanding of the data. “How many boys prefer Vanilla or Chocolate?” involves combining data from two categories within the table.
This worksheet helps students develop essential data analysis skills. By working with a two-way frequency table, students learn to:
- Organize and Interpret Data: They learn to extract meaningful information from a table that presents data in two dimensions.
- Perform Basic Calculations: They practice simple arithmetic operations like addition to analyze the data.
- Draw Conclusions: They use the data to answer questions about the preferences of the students surveyed.
These skills are valuable in various fields, including statistics, social sciences, and business, where understanding and interpreting data is crucial.

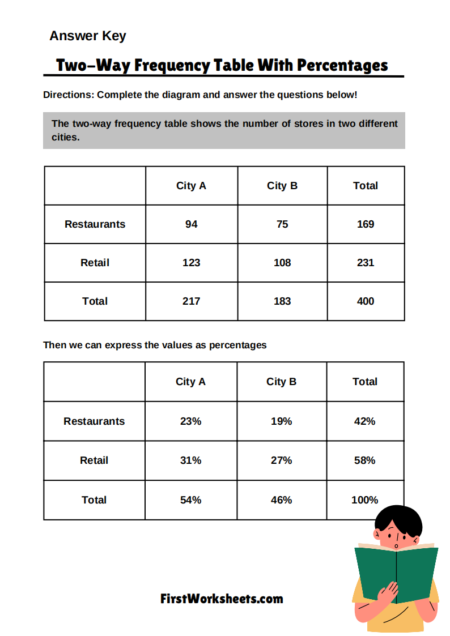
Answer Key

