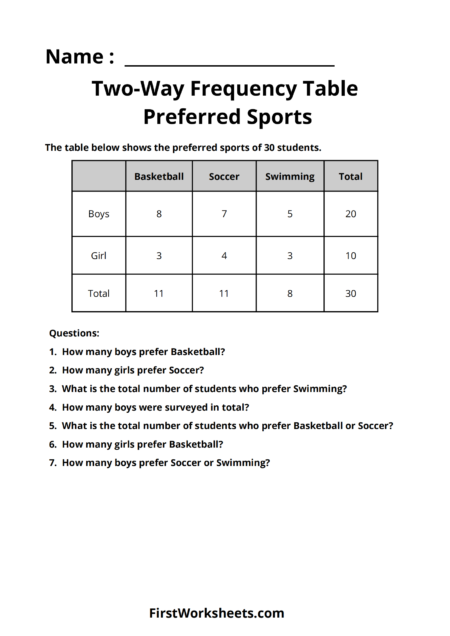
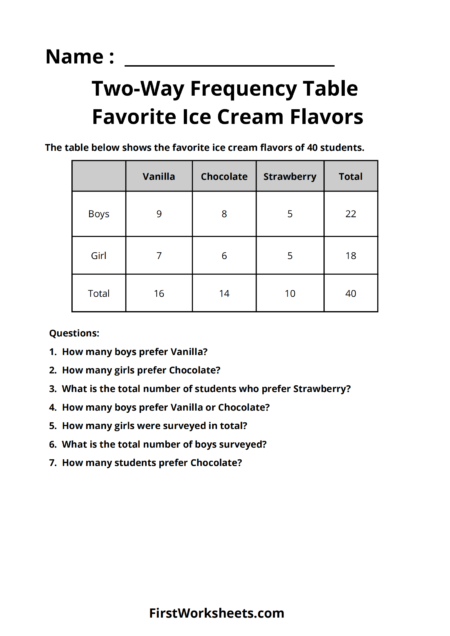
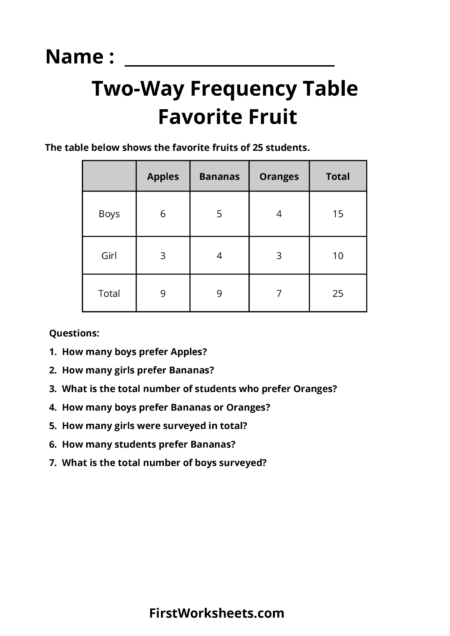
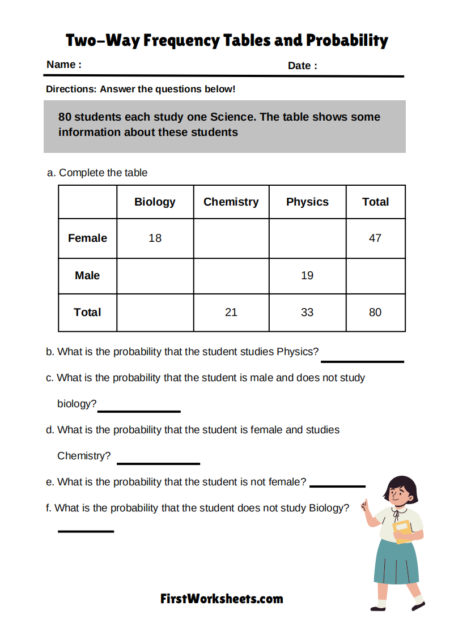
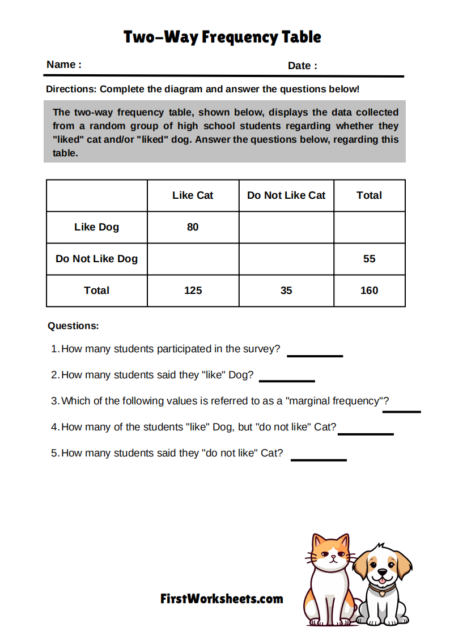
This worksheet is a two-way frequency table. It’s a tool used to organize and analyze data about two categorical variables. In this case, the variables are:
- Gender: The students are categorized as either Boys or Girls.
- Favorite Subject: The students’ preferences are divided among Math, Science, and Art.
The table displays the number of students that fall into each combination of these categories. For instance, it tells us how many boys prefer Math, how many girls prefer Science, and so forth. The “Total” row and column give us the overall counts for each subject and gender, respectively.What is the purpose of this worksheet?This worksheet serves several educational purposes:
- Data Organization: It provides a structured way to present data, making it easier to understand and interpret.
- Data Analysis: It allows for the calculation of frequencies (how often something occurs). This can lead to insights about relationships between the variables. For example, is there a subject that is more popular with boys than girls?
- Question Practice: The accompanying questions prompt students to extract specific information from the table, helping them develop data interpretation skills.
- Mathematical Skill Development: The questions involve basic arithmetic (addition), reinforcing these skills in a practical context.
- Introduction to Statistical Concepts: This worksheet lays a foundation for more advanced statistical concepts like conditional probability and correlation.
This worksheet is a simple but effective tool for teaching students how to organize, analyze, and interpret data. It bridges the gap between abstract mathematical concepts and real-world information, making learning more engaging and meaningful.

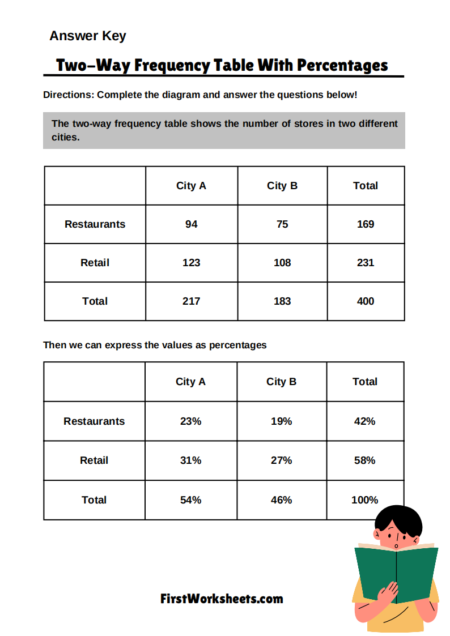
Answer Key

