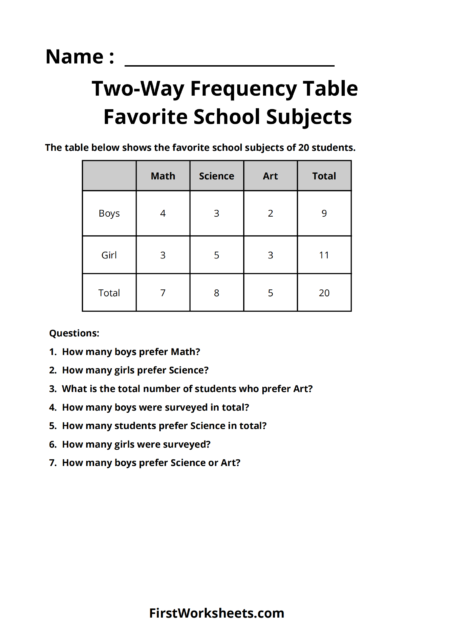
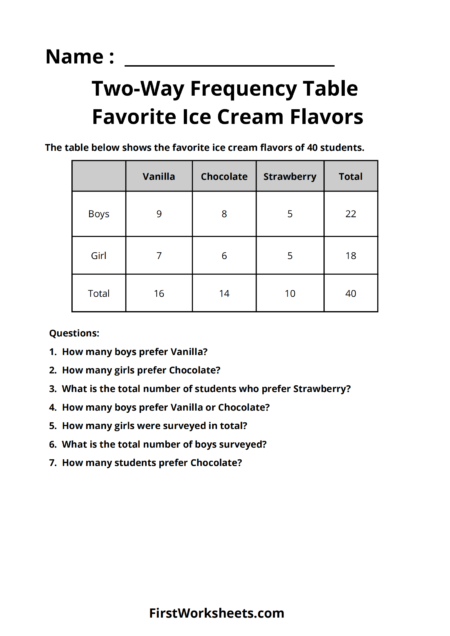
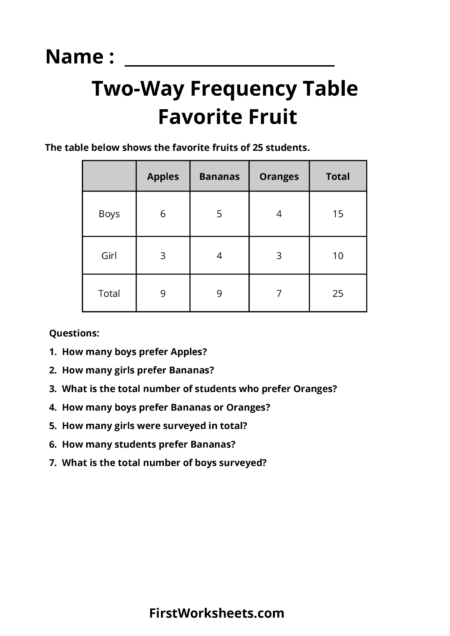
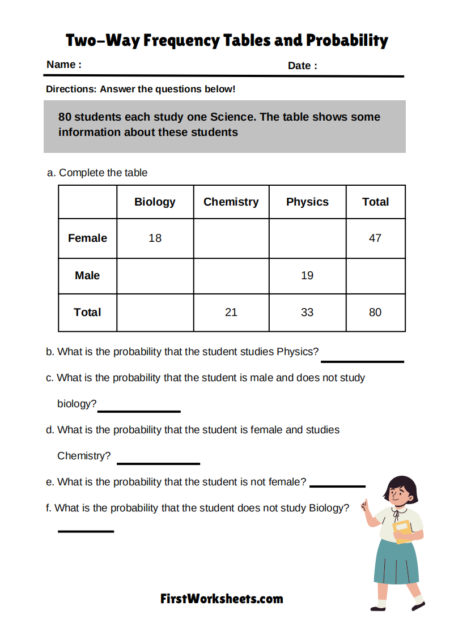
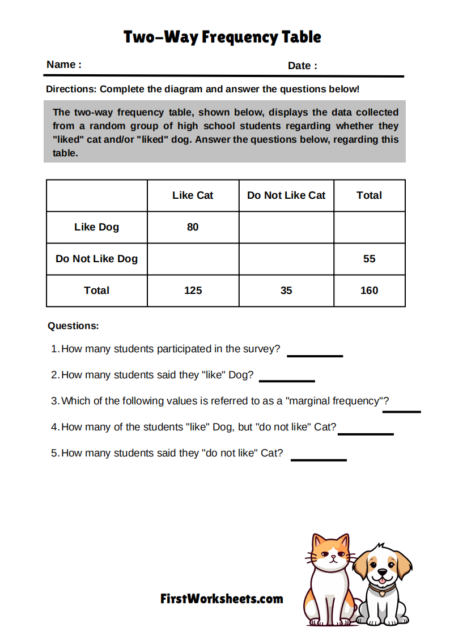
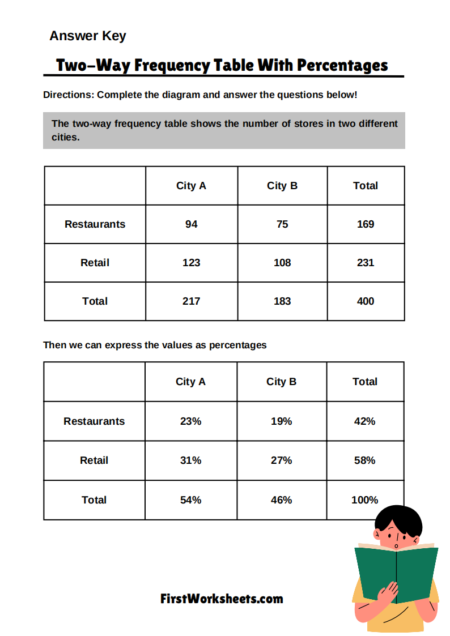
This worksheet focuses on interpreting data presented in a two-way frequency table. The table categorizes a group of 30 students based on their gender (boys and girls) and their preferred sport (basketball, soccer, and swimming).Purpose:
- Data Organization: The table provides a structured way to organize and display data about two categorical variables simultaneously (gender and sport preference).
- Frequency Analysis: It allows for easy calculation of frequencies (counts) for different combinations of categories. For example, one can quickly find the number of boys who prefer basketball.
- Comparison: The table facilitates comparisons between different groups. For instance, you can compare the number of boys who prefer basketball to the number of girls who prefer basketball.
- Identifying Trends: By examining the frequencies, you can identify trends or patterns in the data. For example, you might notice that a particular sport is more popular among boys than girls.
- Answering Questions: The worksheet includes a set of questions that prompt students to extract specific information from the table. This helps them practice reading and interpreting data.
This worksheet is a valuable tool for teaching students basic data analysis skills. It helps them understand how to organize, analyze, and interpret data using a two-way frequency table.

Answer Key

