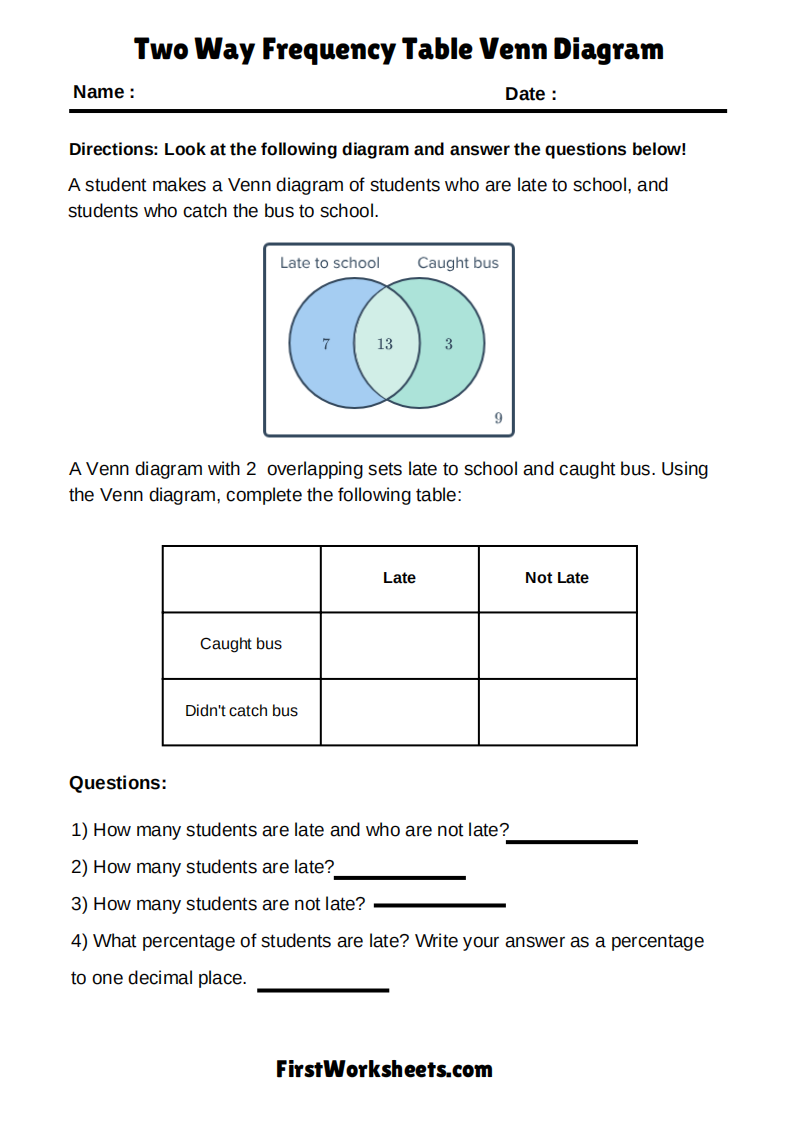
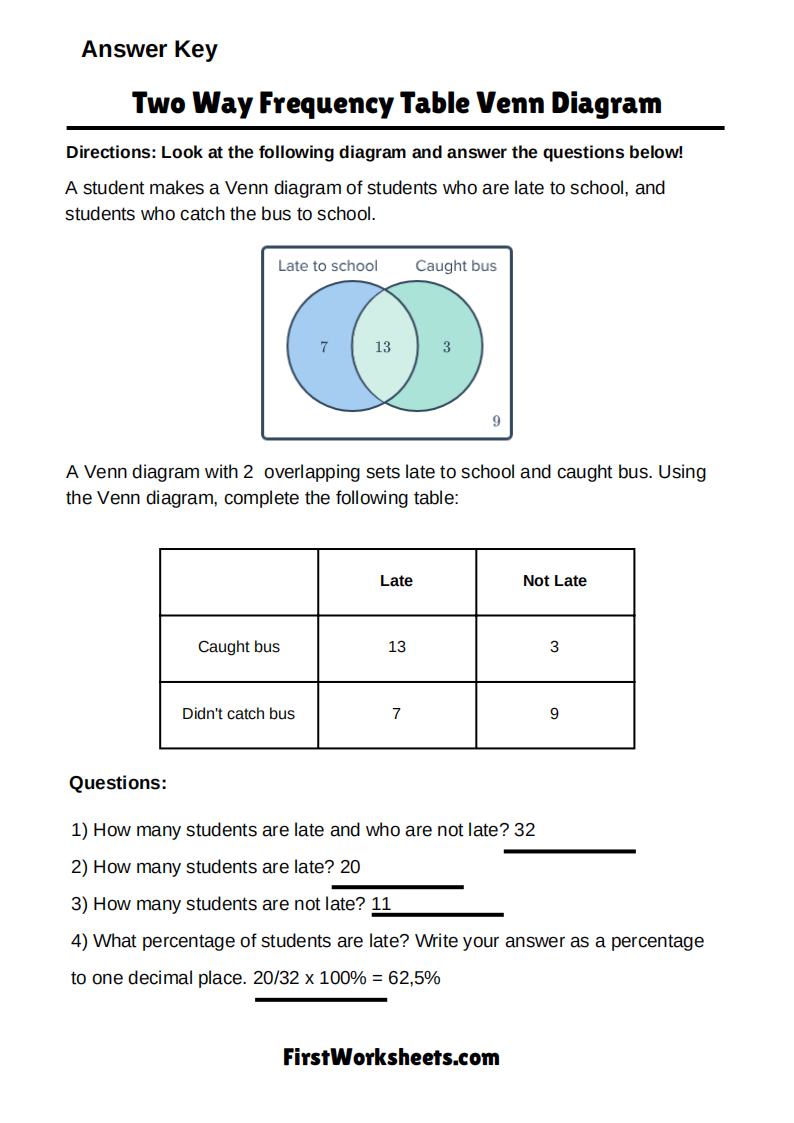
This worksheet is about understanding how to read and interpret Venn diagrams. Venn diagrams are a visual way to show the relationships between different sets of things. In this case, the Venn diagram shows the relationship between students who are late to school and students who catch the bus to school.
The purpose of this worksheet is to help you practice:
- Reading information from a Venn diagram
- Using the information from the diagram to complete a frequency table
- Answering questions based on the data in the table
This type of exercise helps you develop your data analysis and problem-solving skills. These are important skills for many areas of life, not just in math class!

Answer Key
